|
|
A library for working with phylogenetic and population genetic data.
v0.32.0 |


|
|
|
A library for working with phylogenetic and population genetic data.
v0.32.0 |
|
In this tutorial, we explain how color is handled in genesis. We assume the following namespace is given:
Let's start with the Color class, which stores one individual color. It expects three double values for red, green, and blue (or four, with alpha), all of them in the range [ 0.0, 1.0 ]. Alternatively, it can create a Color object from_bytes() (i.e., in the 0 to 255 range) or from_hex() (i.e., "#448EE4"), if needed.
For most use cases, we however want more than one color: We can use a std::vector of Color, as shown later.
For simply picking individual colors (e.g., for a chart), we offer two lists of named colors:
Given their name, color_from_name() retrieves the respective Color entry. Furthermore, color_palette_web() and color_palette_xkcd() yield the whole lists.
For more advanced use cases, one usually wants a palette of colors that are tuned to look good in combination. To this end, we offer three different types of palettes:
0 to 100.-1 to 1.The available color palettes are:
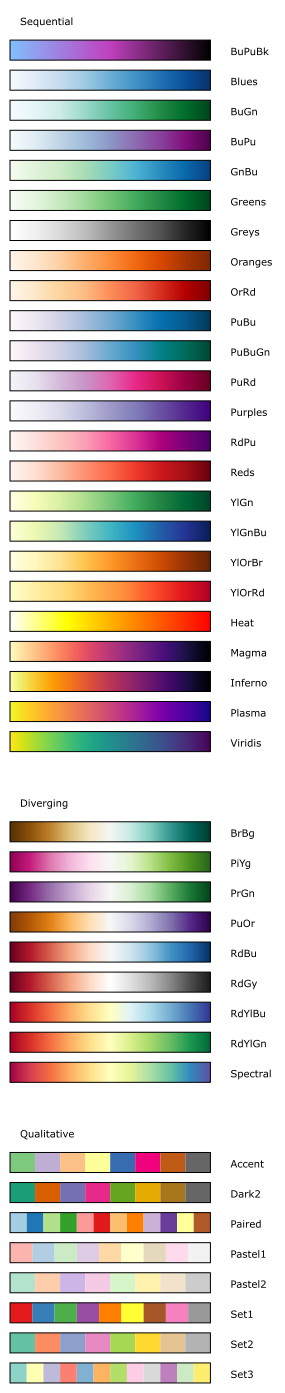
The above list contains color palettes from sources such as ColorBrewer, and viridis that look nice and have favorable properties in terms of their color composition, for example for color blind people. Furthermore, we recommend our own palette BuPuBk (the first one) for visualizing trees, as its lightest color (light blue) is still well visible for the thin branches of a tree when printed on paper.
The palettes can be used by their name, e.g., color_list_viridis(), to obtain a vector of Colors. Furthermore, they can be used via functions that take the name of the list either from an enum or as a string, see e.g., sequential_color_list(). The latter is useful in applications where the user can pick a color scheme.
These palettes are simply stored as a std::vector of Color objects. For artistic users, it is of course also possible to fill a vector with a user defined set of colors.
Often, one wants to use color to visualize a range of values, for example using a color gradient. In order to most easily use the above color palettes to this end, we offer tools to normalize and pick them:
Let's see how they work.
A ColorMap stores a palette and maps the [ 0.0, 1.0 ] interval to the palette by interpolating between colors. This is a simple means to use a color palette (which has a fixed number of entries) to obtain fitting colors for a continuous input:
Colors outside of the [ 0.0, 1.0 ] interval can either be clipped (set to either 0.0 or 1.0), or marked in extra colors in order to visualize these overflows. Furthermore, a special mask_color() can be set for non-finite values (nan or infinite), in order to visualize invalid input. These functions are useful to warn users that something is wrong with their data, by showing the respective issue in the resulting visualization (for example, by coloring a particular branch of a tree).
As the ColorMap expects its input to be in the unit interval, we offer ColorNormalization and its derived classes to bring arbitrary input into that interval:
[ min, max ] interval into the unit interval.[ -1.0, 1.0 ] with 0.0 as the midpoint.See the respective classes for details on their usage.
A simple example with some values in a large range that we want to map logarithmically:
This instance of ColorNormalizationLogarithmic maps 1.0 to the first color of the palette (which is at the 0.0 position of the ColorMap), and 1000.0 to its last (at the 1.0 position of the ColorMap). All values in between are mapped in a logarithmic manner, i.e., 10.0 to the first third (0.33), 100.0 to the second third (0.66), and so forth. The result of the above snippted is a std::vector of Colors.
We use this separation into ColorMap and ColorNormalization to keep each of these classes simple and easy to understand on its own. This is inspired by Matplotlib:
 1.8.17