|
|
A library for working with phylogenetic and population genetic data.
v0.32.0 |


|
|
|
A library for working with phylogenetic and population genetic data.
v0.32.0 |
|
Takes a path to either a jplace file, or a directory containing jplace files, and builds histograms of the the placement mass (according to the like_weight_ratio, LWR) of each placement and of the Expected Distance between Placement Locations (EDPL).
This demo is located at
genesis/doc/code/demos/placement_histograms.cpp
The program takes two arguments:
./placement_histograms <path to jplace file(s)> <path to output directory>
and writes the files histogram_lwr.csv and histogram_edpl.csv in csv format. Those files can be opened with any spreadsheet program (e.g., Microsoft Excel, OpenOffice Calc) and visualized as e.g., histogram bar charts.
The first analysis shows the distribution of the likelihood weights for the placements of the input data. In other words, it shows how probable the placement with the highest likelihood weight is, how probable the one with the second highest is, etc. In order to visualize this information for all query sequences, it is summarized in form of histograms.
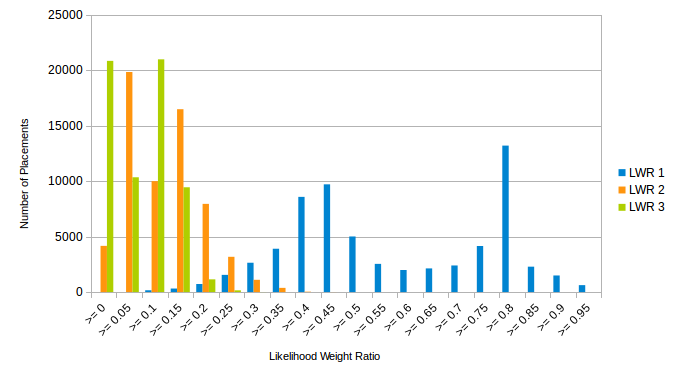
Those histograms can be interpreted as measures of quality of the placements: The chart above shows the histogram of the first three most probable placement positions, measured by their likelihood weight ratio (LWR). The most probable placement location is visualized in blue, the second most probable one in orange, the third one in green. The first LWR shows a peak at the >= 0.8 bin, meaning that many placements are placed with 80% certainty or more.
There is also a second peak in the most probable placement position, around 0.45, indicating that there are quite some sequences that have a somewhat lower certainty. This does not necessarily imply that the placement of the sequences in those bins is incorrect. It can also indicate that there is more than one “good” candidate for placing it – for example, if the corresponding sequence is from a species that does not have a very close relative in the reference, but belongs to the same family as some species in the reference. In this case, one expects to observe placements with a medium probability (likelihood weight) within different branches of the subtree that entails the family.
Thus, as a second analysis, the program assesses the locality of placements distributions for each sequence over the tree. If they are all located in the same part of the reference tree, for example at different branches of one family, this indicates that the sequence can be confidently placed into that clade.
The Expected Distance between Placement Locations (EDPL) is one way of quantifying this locality. The EDPL calculates the weighted distance between all placement positions of a single sequence. For weighting, the likelihood weights are used; the distance is measured along the branches of the reference tree (i.e., the patristic distance between placements). Thus, the EDPL quantifies to which extent the placements of a single sequence are scattered over the tree. See http://matsen.github.io/pplacer/generated_rst/guppy_edpl.html for further details.
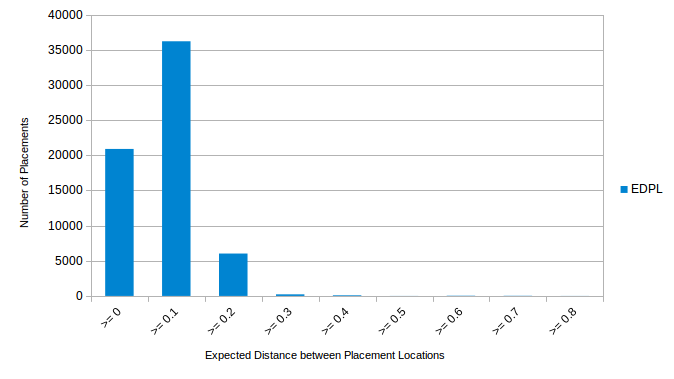
The second chart shows the distribution of EDPL values for our exemplary query sequences. Most of the values are below 0.2. This means that most sequences have a weighted distance that is smaller than 0.2 between alternative placements (measured in branch length units). Note that, the maximum likelihood reference tree used for the example has an average branch length of 0.12. Thus, the placement scatter (or radius) for almost all query sequences is smaller than two branches, on average.
Our example can be summarized like this: Many sequences have a placement probability of 80% or higher. But even those with a lower probability for the most likely placement are spread over nearby, local branches of the reference tree. Hence, the vast majority of placements shows high confidence with respect to a single branch or a local neighborhood of branches.
 1.8.17